Filter Categories
All
Our consulting services begin with the selection of the appropriate method, the development of the study concept, the recruitment of the right subjects – whether online or offline – through the implementation of the field phase and quality control to the structured analysis of the data and preparation of the results report full of concrete recommendations for action.
Team
Our team is experienced, interdisciplinary, competent, fast and super flexible.
Experience
In addition to our wealth of experience, we have extensive industry benchmarks, so you can always measure yourself against the competition.
Especially in an agile environment, speed and flexibility are in demand – with a UX Quickcheck, for example, you get prioritized recommendations for action from our experts within a few days.


User Experience (UX) describes the experience of a user interacting with a (digital) product, service or environment. User Experience is a holistic concept that encompasses more than the usability or practical usability of a product. Emotional aspects, such as liking a page or an app and the enjoyment of use, determine the UX just as the pragmatic part, such as usefulness or efficiency.
A positive user experience is a prerequisite for your product to succeed on today’s market. Our extensive portfolio of implicit and explicit methods captures all emotional and cognitive responses of users interacting with your product.
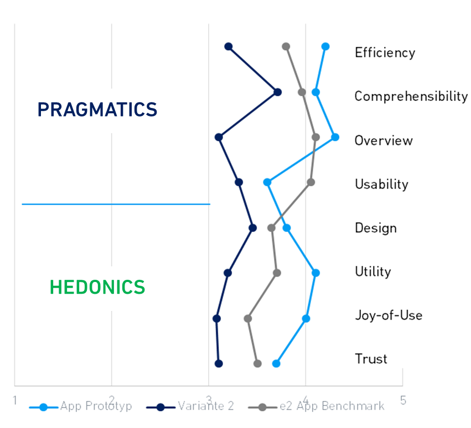
The e2 benchmark database includes data from more than 300 studies and ables us to compare your results to your competition.
We will help you to better understand your target audience, adjust your product to the user, and improve the conversion of your website or app. Use our studies to ensure user-friendly development of your product and its success.
User Experience (UX) describes the experience of a user interacting with a (digital) product, service or environment. User Experience is a holistic concept that encompasses more than the usability or practical usability of a product. Emotional aspects like liking a page or an app and the enjoyment of use determine the UX just as the pragmatic part, such as usefulness or efficiency.
A positive user experience is a prerequisite for your product to succeed on today’s market. Our extensive portfolio of implicit and explicit methods captures all emotional and cognitive responses of users interacting with your product. The e2 benchmark database includes data from more than 300 studies and ables us to compare your results to your competition.
We will help you to better understand your target audience, adjust your product to the user, and improve the conversion of your website or app. Use our studies to ensure the user-friendly development of your product and its success.
 
Deep dive into user needs and behavior, understand drivers and barriers regarding product usage
Our evergreen and number one approach
Tangible suggestions optimize your product through moderated 1:1 sessions. Also available as a quick/agile user testing in just one day.
Add-on Smartphone Eye Tracking
Online survey on smartphone. Understand user’s mental model. Add implicit insights by analyzing attention in a natural setting.
Qualitative understanding of your target group
In depth insights into the user needs through methods such as personas, in-depth interviews, focus groups.
Gather statistically relevant and reliable insights into the performance and acceptance of a product
Discover your product’s
strengths and weaknesses.
A fast and efficient comparison of your product against the competition.
Measure conversion and performance
in a task-based online survey with a large sample & benchmarking. The report includes user behavior measurement and scaled evaluation.
Deep dive into user needs and behavior, understand drivers and barriers regarding product usage
Gather statistically relevant and reliable insights into the performance and acceptance of a product
Our evergreen and number one approach
Tangible suggestions optimize your product through moderated 1:1 sessions. Also available as a quick/agile user testing in just one day.
Add-on Smartphone Eye Tracking
Online survey on smartphone. Understand user’s mental model. Add implicit insights by analyzing attention in a natural setting.
Qualitative understanding of your target group
In depth insights into the user needs through methods such as personas, in-depth interviews, focus groups.
Discover your product’s
strengths and weaknesses.
A fast and efficient comparison of your product against the competition.
Measure conversion and performance
in a task-based online survey with a large sample & benchmarking. The report includes user behavior measurement and scaled evaluation.
Please Contact Us

Telephone +49 30 698144-28
Fax +49 30 698144-10
delopez@eye-square.com
You are currently viewing a placeholder content from reCAPTCHA. To access the actual content, click the button below. Please note that doing so will share data with third-party providers.
More InformationMore UX Tools
eye square compares your website with a wide benchmark of over 350 studies with interactive systems, your own test stimuli and the industry benchmark.
As of February 2022

eye square compares your website with a wide benchmark of over 350 studies with interactive systems, your own test stimuli and the industry benchmark.
Examples:
As of February 2022

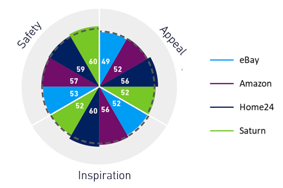
The e2 ProductREACT is an implicit method that takes reaction times into account and measures the ‚gut feeling‘ and intuition of users: Is the evaluated site attractive, inspiring, and does it evoke trust?
Data evaluation is based on reaction times: How fast do users agree or disagree?

Home 24 is evaluated most attractive and inspiring.
In terms of safety Saturn performs best with a score of 60, eBay weakest with 53 – probably due to various sellers.
You need to load content from Turnstile to submit the form. Please note that doing so will share data with third-party providers.
More Information